
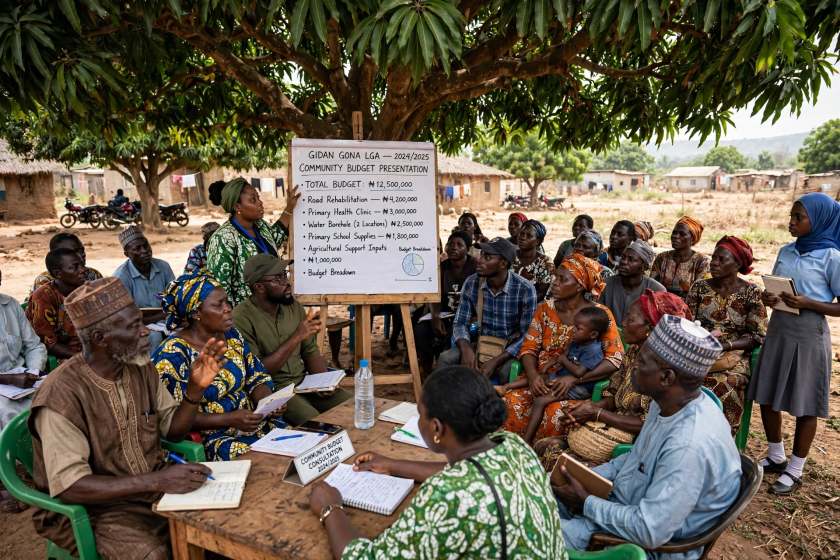
Evaluating a local government Council budget in Nigeria goes beyond checking if money was spent. You need to check if it was planned legally, allocated fairly, spent transparently, and delivered results for residents.
Here are the main criteria used by auditors, civil society, legislators, and researchers:
1. Legal and Policy Compliance
- Constitutional basis: Does it comply with Section 7 and Section 162 of the 1999 Constitution (as amended) on local government autonomy, joint account, and functions in the Fourth Schedule?
- State laws: Does it follow the State Local Government Law, Financial Memoranda, and State Fiscal Responsibility Law?
- Approval process: Was it passed by the Legislative Council, signed by the Chairman, and published before implementation?
- Procurement compliance: Were contracts awarded under the Public Procurement Act / State Procurement Law, with tendering and due process?
2. Revenue Realism and Credibility
- Revenue forecast accuracy: How close were projected Internally Generated Revenue (IGR), FAAC allocation, VAT, grants, and loans to actual receipts?
- IGR effort: Is the Council over-dependent on FAAC, or is it growing IGR from rates, tenement rates, markets, motor parks, licences, and fees?
- Budget credibility: Compare approved budget vs. actual revenue and expenditure. A variance above 15-20% consistently suggests poor planning or padding.
3. Allocation and Prioritization
- Alignment with needs: Does spending match the Council’s development plan, ward needs, and statutory functions like primary health, primary education support, rural roads, water, sanitation, and markets?
- Recurrent vs. Capital ratio: In Nigeria, many Councils spend 80-90% on salaries and overheads. A healthy budget should protect a meaningful share for capital projects.
- Equity: Are projects spread fairly across wards, not concentrated in the Chairman’s ward or headquarters?
- Pro-poor focus: What share goes to basic services that affect women, youth, traders, farmers, and persons with disabilities?
4. Execution and Efficiency
- Budget execution rate: % of approved capital budget actually spent and % of projects completed. Low execution often means abandoned projects.
- Timeliness: Were projects completed on schedule and within approved cost? Check for cost overruns and variation orders.
- Value for money: Economy (lowest reasonable cost), Efficiency (output per naira), and Effectiveness (did it solve the problem?).
- Payroll integrity: Is there ghost-worker control, BVN verification, and a clean nominal roll?
5. Transparency and Participation
- Public participation: Were community leaders, CDAs, traditional rulers, women groups, and youth consulted before the budget was drafted?
- Openness: Is the approved budget, quarterly reports, and audited statements published on notice boards, radio, or online?
- Access to information: Can citizens get project details, contractor names, and costs on request under the Freedom of Information Act?
6. Accountability and Audit
- Internal controls: Are there functional Internal Audit, Finance and General Purpose Committee, and Legislative oversight?
- External audit: What did the State Auditor-General for Local Governments find? Look for unretired advances, unaccounted cash, and extra-budgetary spending.
- Debt and liabilities: Did the Council take loans without approval? Are pension arrears, contractor debts, and staff salary arrears growing?
- Asset management: Is there an asset register for vehicles, buildings, and equipment? Are assets maintained or abandoned?
7. Outcomes and Service Delivery Impact
This is the most important test: money spent is not the same as results delivered.
- Outputs: How many boreholes, PHCs renovated, classrooms built, roads graded, drains cleared?
- Outcomes: Did school enrolment, immunization coverage, access to clean water, or market revenue improve?
- Sustainability: Are completed projects functional 1-2 years later, with maintenance budget and community ownership?
- Citizen satisfaction: What do residents say in town halls, scorecards, or social audits?
A simple framework to use
You can score each Council budget on 5 questions:
- Was it legal? Approved, published, and procured properly
- Was it realistic? Revenue forecasts matched reality
- Was it fair? Spending reached all wards and basic services
- Was it well spent? High execution, low waste, completed projects
- Did it change lives? Measurable improvement in services
Next time your local government chair starts claiming that he or she delivered, remember to pullout this post and confront him or her using the very clear criteria and questions in this AI generated post.
Noel Ihebuzor – ONYENKUZI

